
A landmark study (paywall) landed on our doorsteps last week not with a thunderous crash, as it should have, but with a gentle thud. Investigators from UCLA’s School of Public Policy published a cross-sectional analysis of where money paid for insulin actually went in the years 2014-2018.
An accompanying editorial (also paywalled) aptly describes the methodology of this research paper as “daunting,” given the difficulty in getting information in such an opaque marketplace. The investigators had to compile data on 32 separate insulin products from The SSR Health Rx Brand Pricing Data Tool, a commercial pharmacy claims database, CMS records, individual state Medicaid and drug transparency reports, and public filings of participant companies, including not only drug manufacturers, but drug wholesalers, pharmacies, pharmacy benefit managers (PBMs), and insurance companies themselves. Their methodology was complex enough that I’m not sure I completely understand it, and I’m confident I can’t pass it on to you in less than 800 words. So I’m going to get down to the nitty-gritty. First, here is their helpful schematic on the flow of money in the drug pipeline, which I found to be as good as about any explanation I’ve come across:

JAMA Health Forum
You can see that the key breakdowns in this complicated flow of goods and services are at points (2) and (7), where kickbacks from the manufacturer to the PBM (also known as “rebates”) are paid to move a drug up the formulary and where the PBM subsequently passes a share of those rebates on to the benefit plan.
Between 2014 and 2018, the average list price of the 32 insulin products rose 40.1% (inflation over the same period was 5.96%). So the list price of insulin rose eight times as fast as the list price of, say, dishwashers.
At the same time, though, the average net price paid to manufacturers fell by 33.0%. So, for example, Eli Lilly, the oldest insulin manufacturer in the United States, got $69.71 of every $100 spent on its insulin products in 2014. By 2018, they were getting only $46.73 out of every $100 spent.
Similarly, the share going to health plans (as those sneaky “rebates”) fell by 24.7%, and the share of expenditures retained by drug wholesalers increased by 74.7%, from $4.63 to $8.09, although the absolute costs were obviously low in comparison to others in the chain.
Reader, prepare your body for the coming rage (I recommend some light stretching and some John Tesh on the stereo). The share of insulin expenditures going to PBMs from 2014 to 2018 rose 154.6%, from $5.64 to $14.36 of every $100 spent. And the share retained by pharmacies increased by 228.8%, from $6.21 to $20.42.
If you can still read through all the red mist, let me reiterate this: Let’s say that you and your diabetic employee together pay ~$115 to insurance company X in December. Insurance Company X will then take its allowed Medical Loss Ratio of ~$15 and spend the remaining $100 on insulin. Of that $100, the breakdown of who gets what is below:
Manufacturer: $46.73
Wholesaler: $8.09
Pharmacy: $20.42
PBM: $14.36
Health insurer: $10.40
Here’s the same information in graphical form, which is helpful to see the change over time:
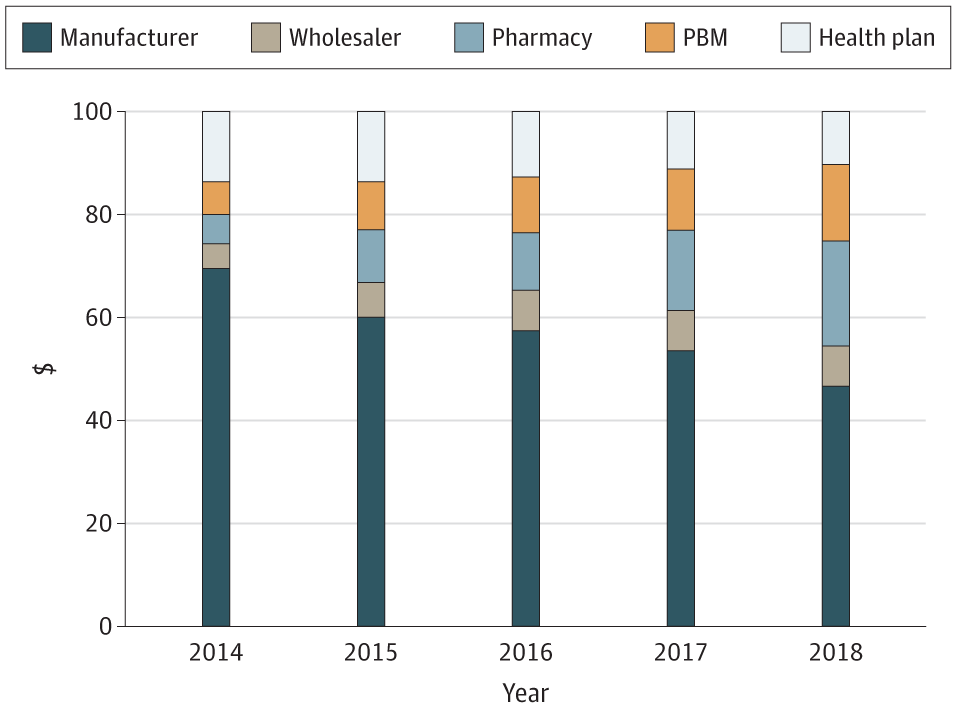
JAMA Health Forum
Understand that about a quarter of people on insulin–your employees–report routinely skipping doses because of insulin’s tremendous expense. While those people are very likely shortening their lives because they can’t afford their drugs, PBMs, pharmacies, and to lesser extent wholesalers, are taking ever-greater shares of the money that you and your employees pay for the insulin, all while stiffing the manufacturer. I don’t mean to let the manufacturers off the hook; the pharmaceutical industry is the most profitable industry in America by a healthy margin. But we need to recognize that every participant in the distribution system for insulin, from the manufacturer to the PBM to the pharmacy, shares some of the blame for the astronomical increase in price that we’ve experienced over the last decade or more.
Outside of breaking out the pitchforks and torches, what can be done about this problem? A lot, we believe. As we’ve outlined before, you can look at your PBM contract to make sure you have access to your data, that you are allowed to access underlying contracts of your PBM, and that you can get out of your contract in a reasonable amount of time. With that information in hand, you can challenge new clinical approvals for low-impact drugs added to your formulary. You can even buy generics directly from the manufacturer. And, if you’re a member of KBGH, you could immediately cut pharmaceutical costs even without uncomfortable conversations with your PBM by working with our Right Rx program.
As the Medical Director of the Kansas Business Group on Health, I’m sometimes asked to weigh in on hot topics that might affect employers or employees. This is a reprint of a blog post from KBGH.